

Realtime analytics and insights
Supercharge your business with the power of Data.
Modern businesses are run on information & knowledge. To improve your bottom line and expand your business, you need to have the right information available on time. Fundamentals of good data management is of paramount importance. Make reliable, data driven decisions. Take your business to the next level with our data-platform.

• Are unreliable and delayed insights slowing down your decision-making?
• Do data silos, duplication, and inconsistencies create inefficiencies across teams?
• Are compliance risks and regulatory challenges becoming a growing concern?
If these challenges sound familiar, it’s time to rethink your data strategy. Discover how our powerful data analytics platform can help you gain real-time insights, unify your data, and ensure compliance with ease. Let's transform your data into a strategic advantage!


Collect data from different data sources on one bench and logically combine them, group them, pre-aggregate and store it.

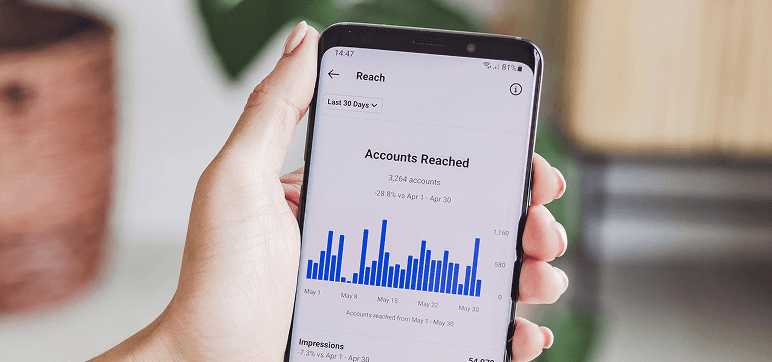
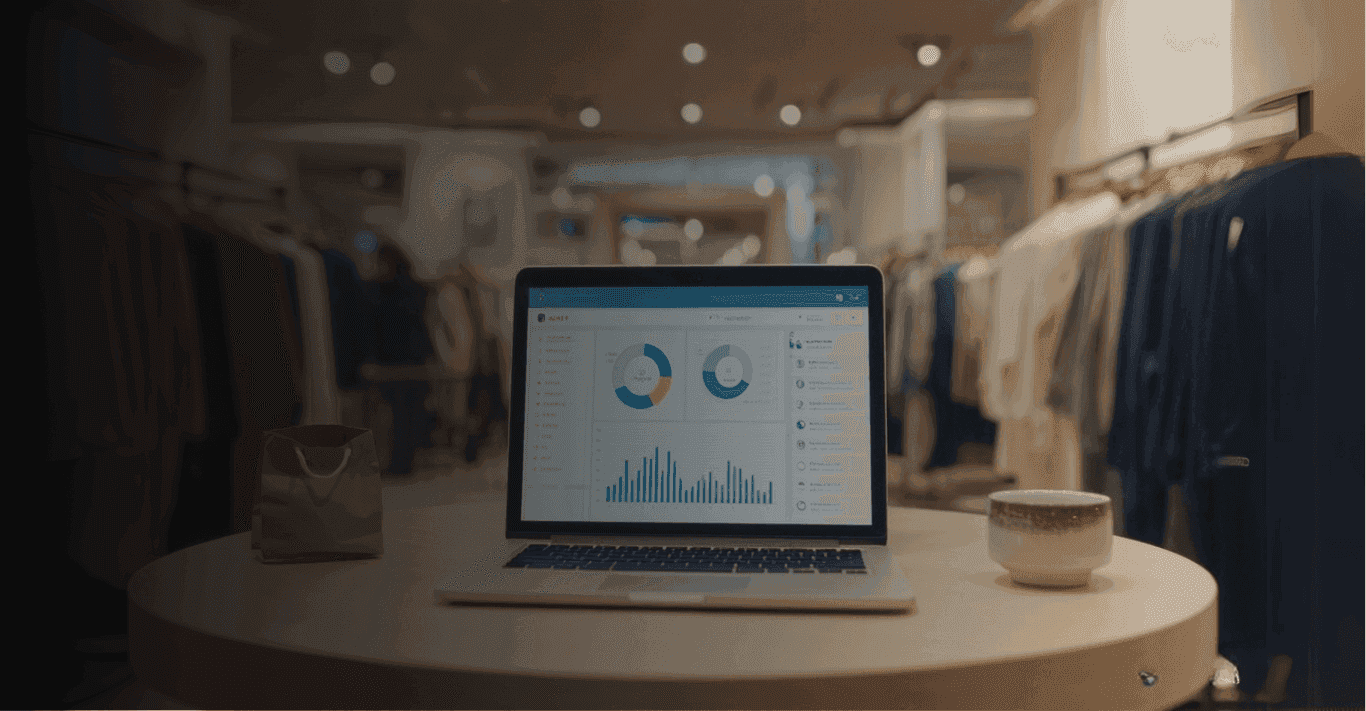
With the responsiveness of our Web Application and with a super powered Native Apps, the dashboards are made available on your handheld devices as a quick decision making tool.

RAIN is specifically designed and built with customization, personalization and native integration capabilities in mind.
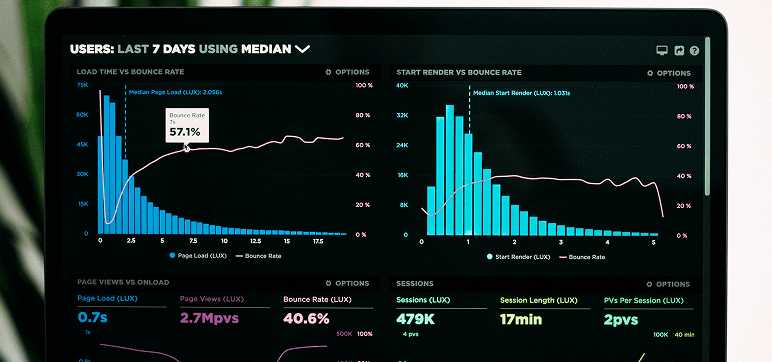
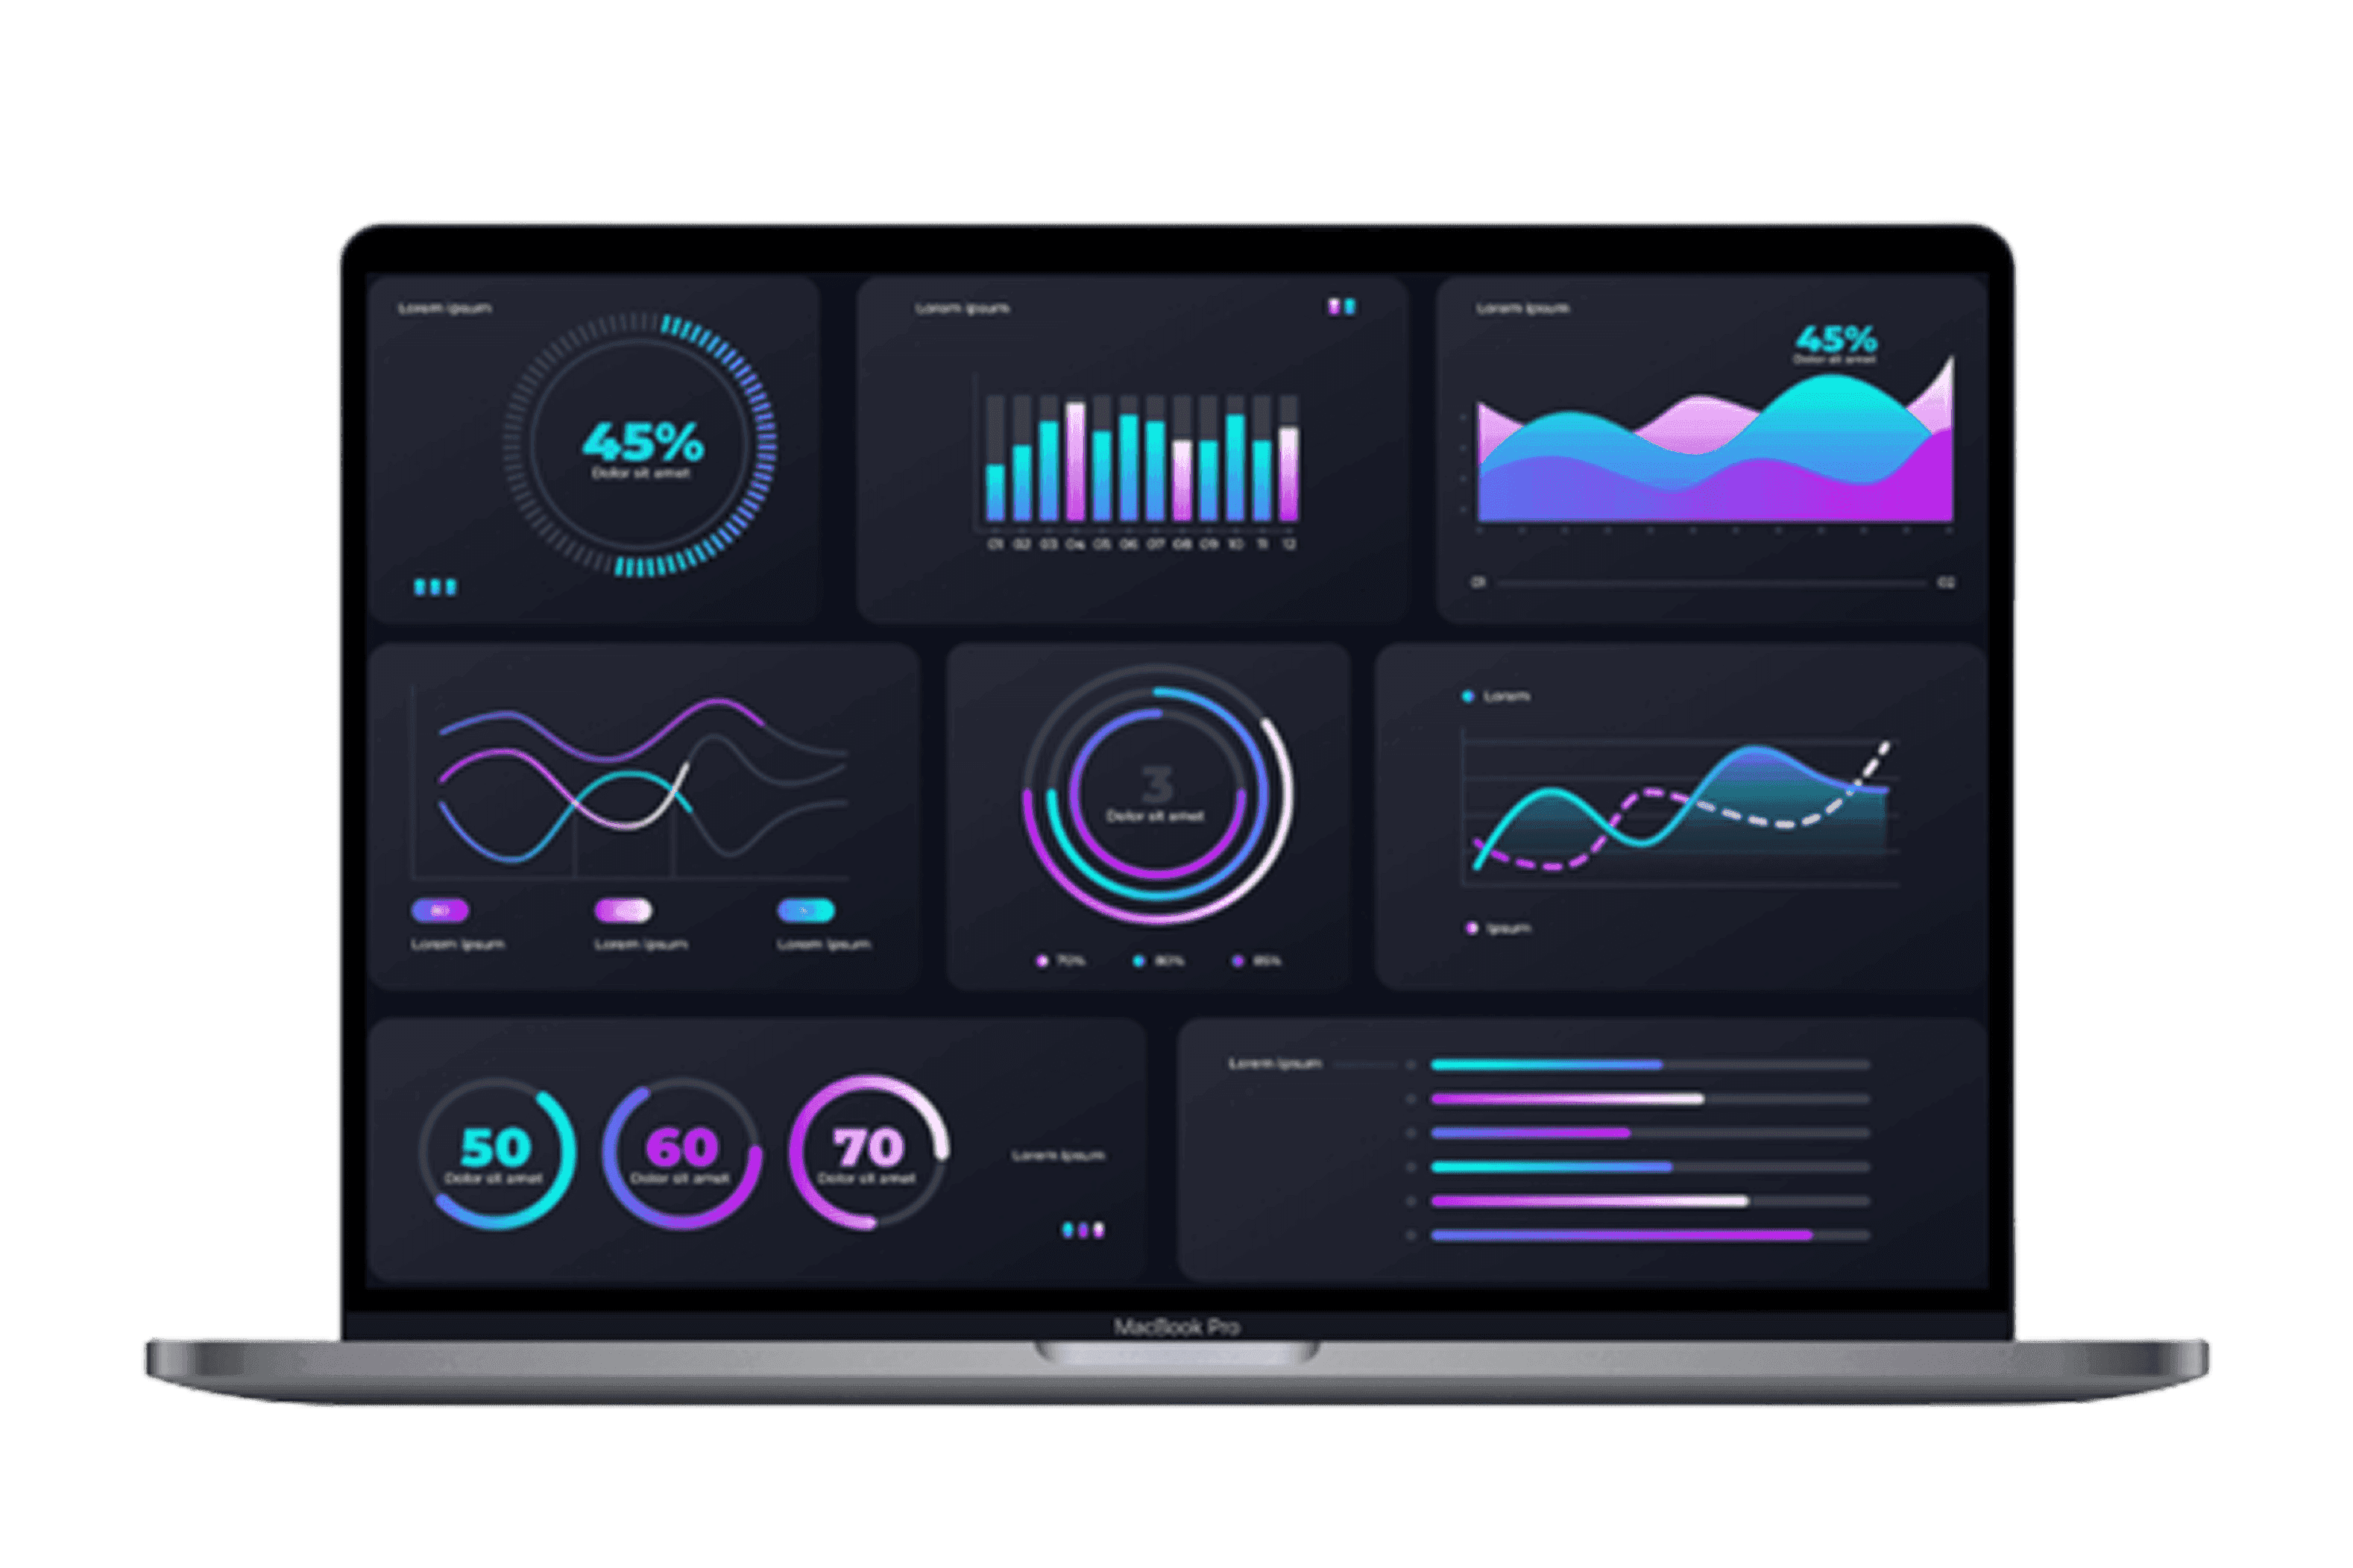
Collect data from diverse sources, process and visualize. Make relevant visualizations available to the users based on their roles on preferred channels - Mobile or Web.


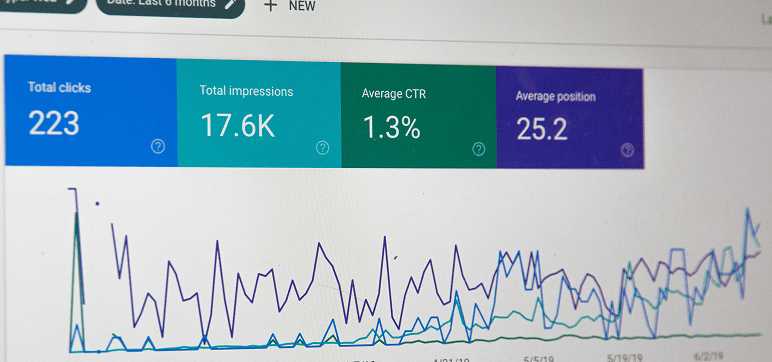
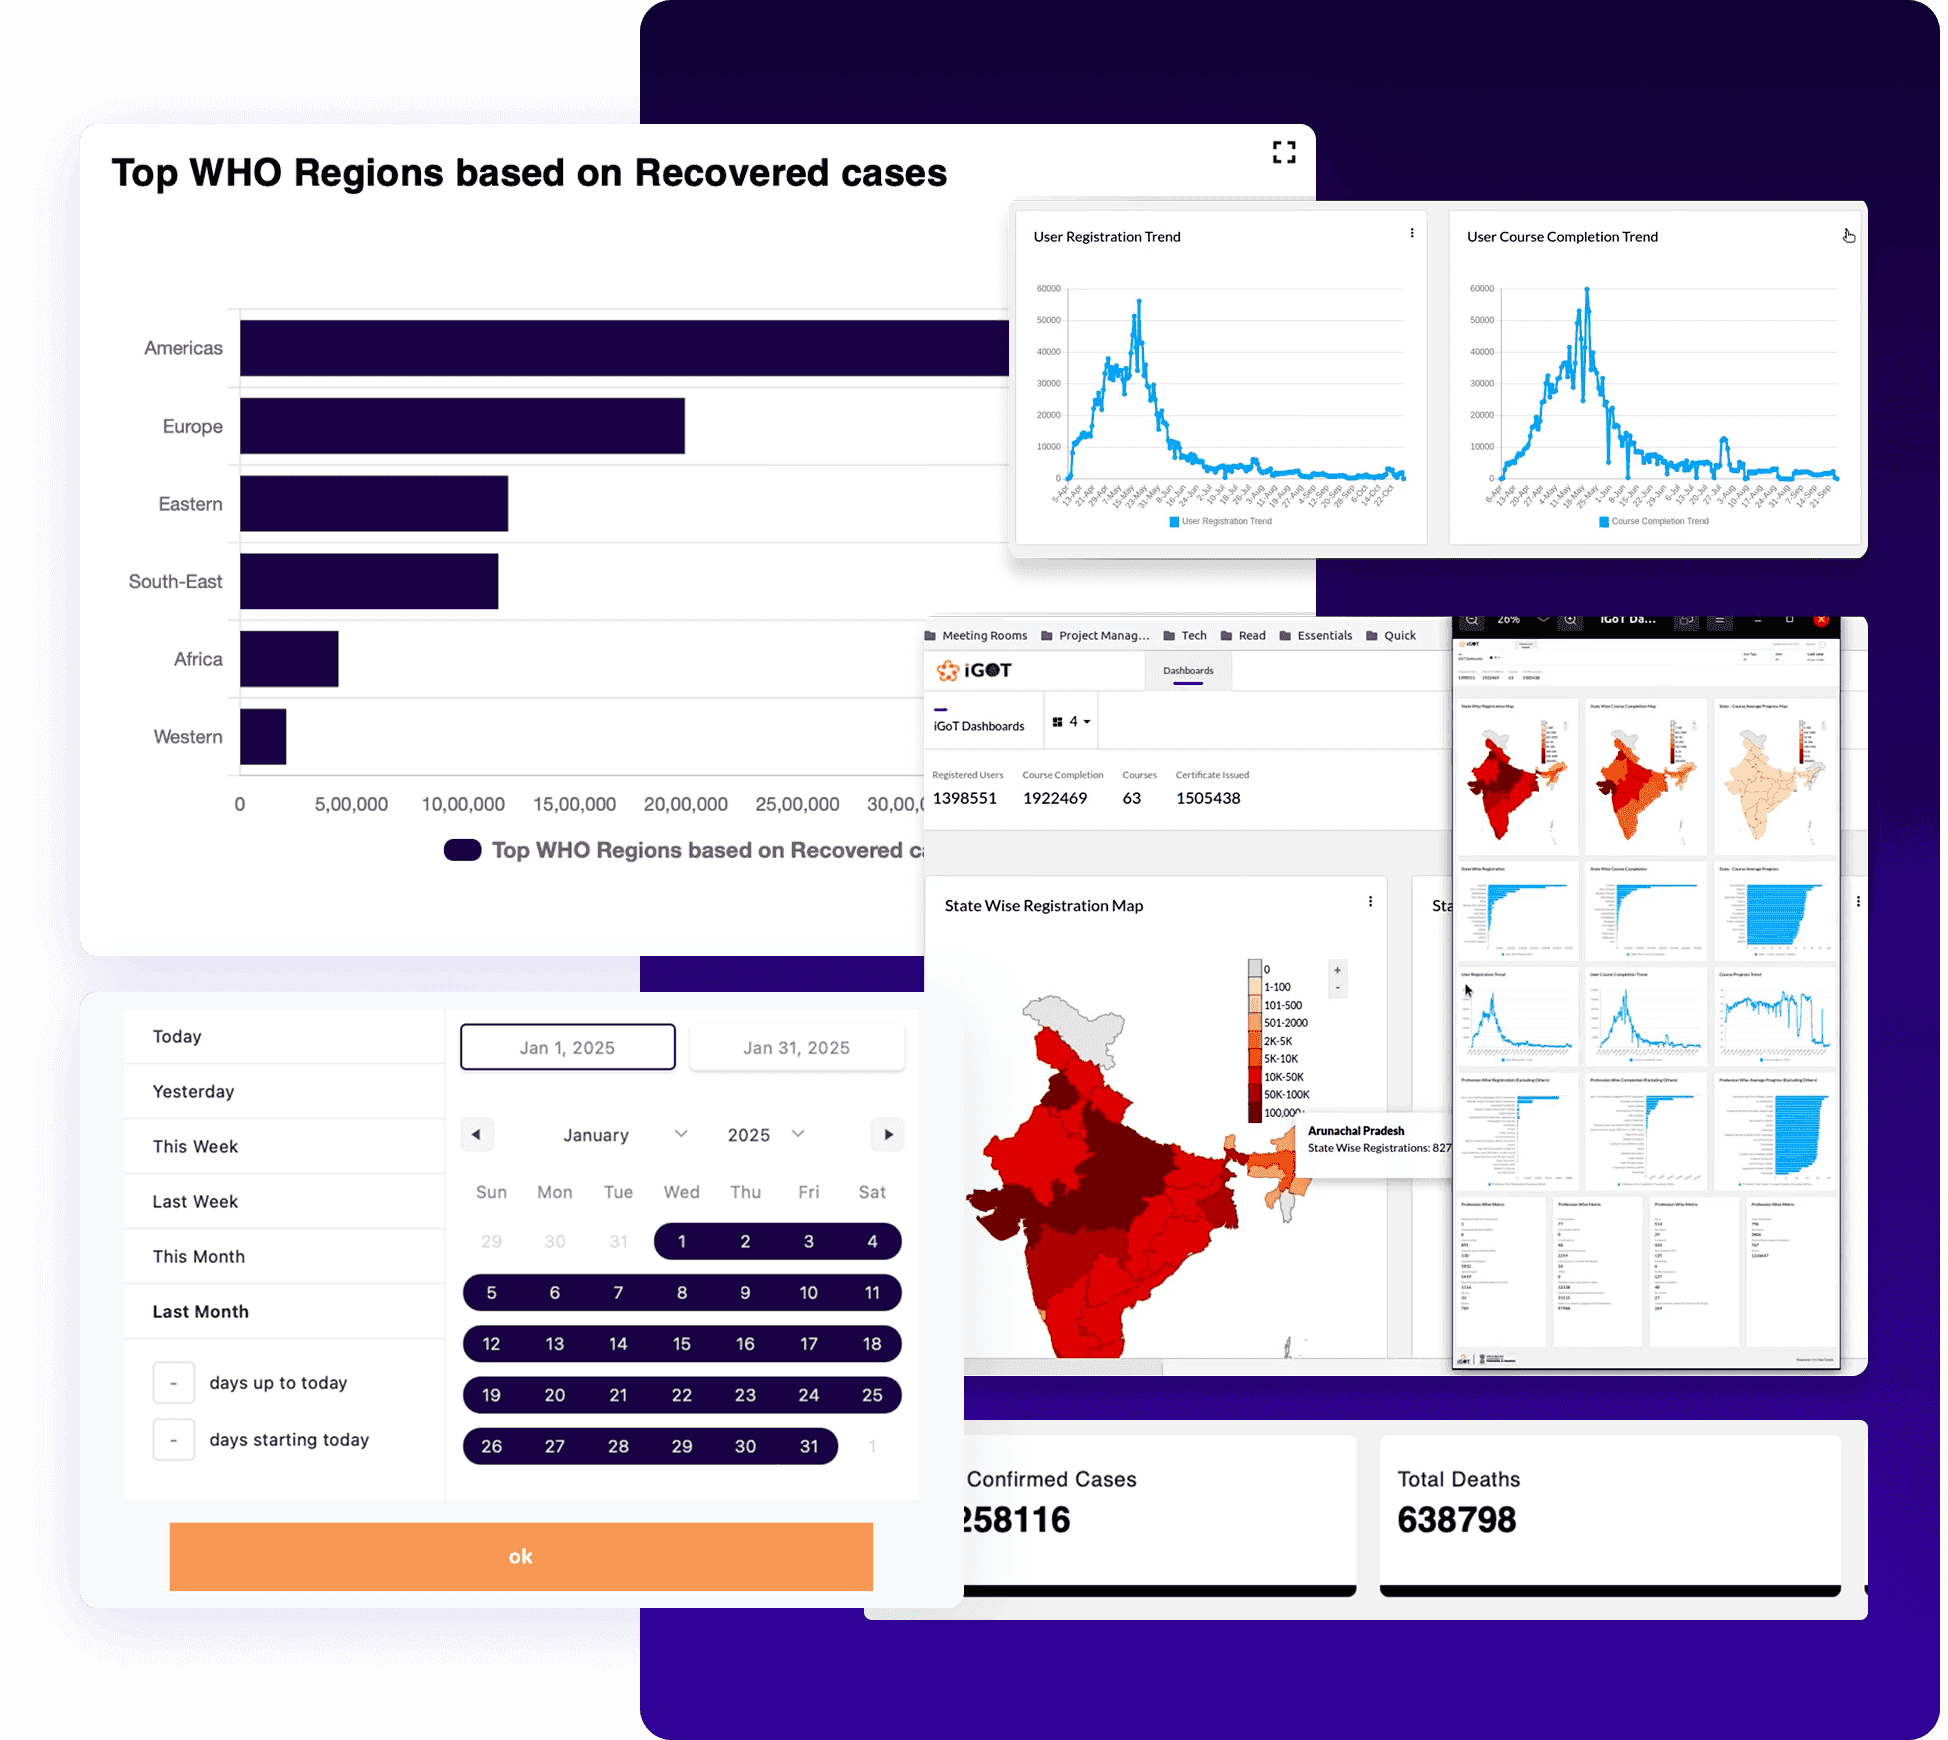
Visualizations ranging from a simple bar chart to map visualizations. User has the freedom to create multiple dashboards with different collections of visulizations.

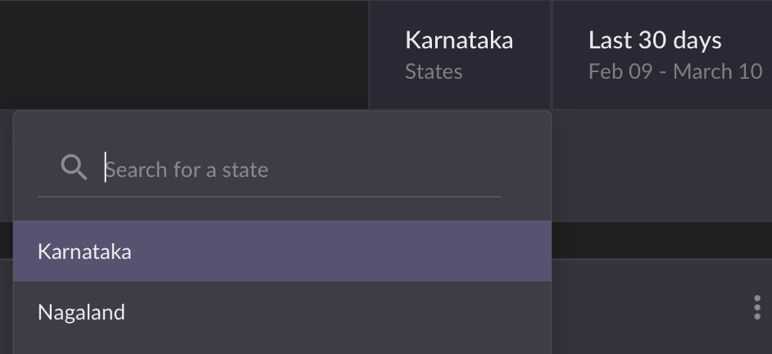
Make more of the data and analyse by using default date filter and custom filters, drill-downs and drill - throughs.

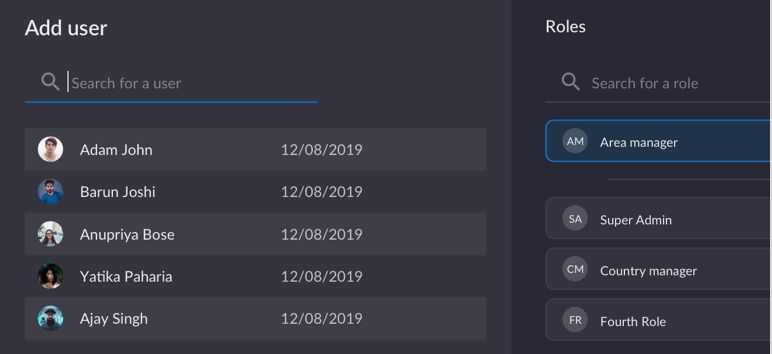
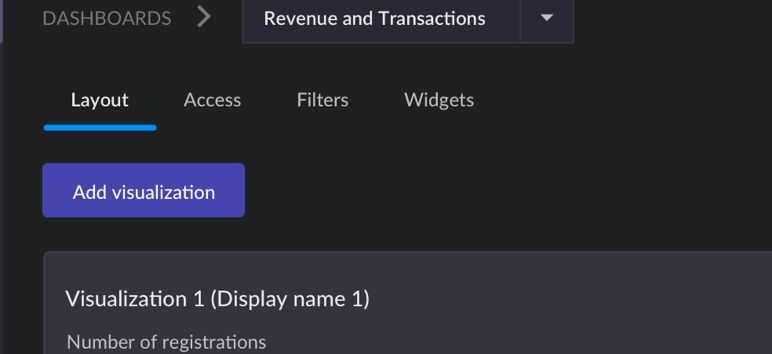
An integrated Admin interface is available where user roles, access, dashboard layout, filters, reports etc. can be controlled.

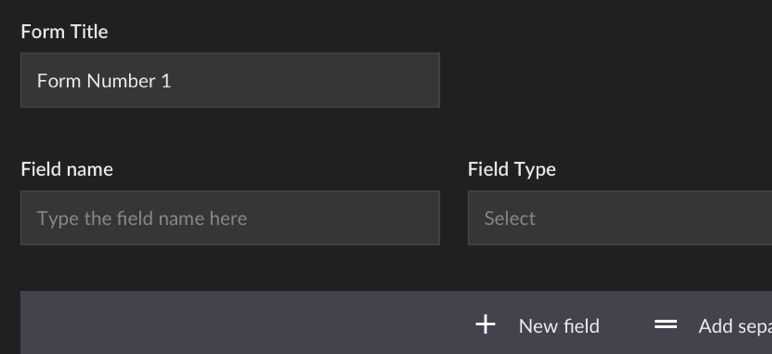
Users can create forms which can collect different types of data and the same data can be fetched by the data pipelines to show realtime visualizations.

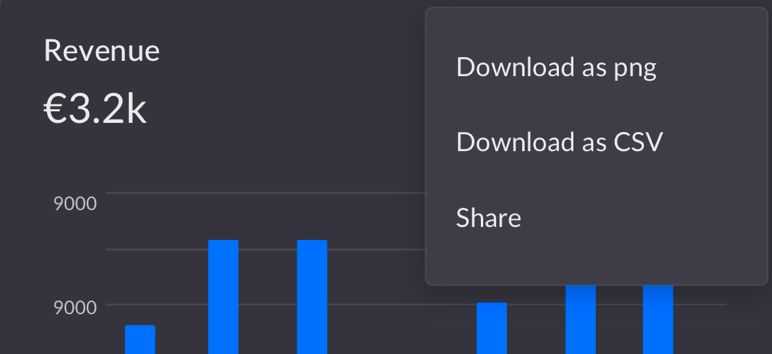
User can create reports, download or share visualizations/reports in multiple formats.

RAIN comes by default in light and dark theme. It has been designed to enable quick and easy customization as well.


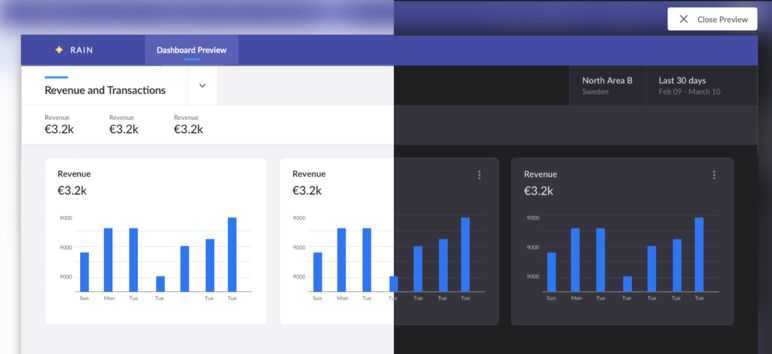
Retail
Effortlessly monitor retail performance with our interactive dashboard cards on your website.
Explore

Worldcup
Track World Cup action live with our dynamic dashboard card, featuring real-time scores and match updates.
Explore

Healthcare
Monitor vital healthcare metrics with our interactive dashboard card, providing insights for informed decision-making.
ExploreImplementations


Want to unlock the full potential of your data? We’re here to help! Reach out to us, and let’s explore how RAIN can transform your business with powerful insights.
Explore More Accelerators
Proven platforms that scale seamlessly at a country level, deploy quickly, and adapt to diverse organizational needs. With fully in-house hosting, you maintain complete control over your data.

